The International Trade Blog ![]() International Sales & Marketing
International Sales & Marketing
22 Insane Supply Chain Statistics [DATA]
On: July 18, 2022 | By:  Kari Crane |
6 min. read
Kari Crane |
6 min. read
 Supply chain management has taken center stage the last several years, beginning with disruptions related to the COVID-19 pandemic. At one time, shipping professionals were predicting a return to normal as pandemic pressures eased and the world got back to business. But the following supply chain facts show what importers and exporters now know: Supply chain pressures are here to stay.
These are just a few of the issues that continue to challenge importers and exporters:
- Shipping costs and freight rates are expected to remain abnormally high into next year, fueling inflation.
- China’s “zero-COVID” policy continues to cause bottlenecks.
- Imminent labor negotiations at California ports are leading to unease, with some shippers diverting to the East Coast, causing additional delays and snarls.
- Unprecedented sanctions against Russia have forced international traders to pivot.
To be successful amid the chaos, companies need to build resilience into their supply chains and be prepared to handle logistics challenges they may not have imagined in the past. (We have written a few articles to help with these aspects of exporting: How to Manage Disruptions in the Supply Chain and Tips to Build a Reliable Supply Chain and Improve Visibility.)
Supply Chain Statistics
At Shipping Solutions we follow these changes closely, so we can do our part to help guide our readers through challenging times. Today we want to share some of the supply chain stats that have caught our attention recently.
General Facts
1. 90% of the world's merchandise is shipped by sea, which is exacerbating global inflation thanks to the rise in shipping costs.-1.png?width=400&height=347&name=Supply%20Chain%20Statistics%20%233%20(2)-1.png)
2. The Federal Reserve’s Beige Book publication, put out eight times a year, looks at economic conditions across the 12 Federal Reserve districts. The most recent publication shows that all districts across the country are struggling with supply-chain issues, including high costs, a tight labor market, manufacturing backlogs and transportation disruptions.
3. 43% of U.S. workers are in supply-chain industries, employed either at lead firms or their suppliers.
4. Companies’ dependence on a single supplier has made the disruptions of the last few years even more impactful. But this is true whether companies use suppliers abroad or at home. The severe 2021 freeze in Texas led to months-long disruptions in U.S. and global supplies of plastics because of the concentration of petrochemical companies there, according to a 2022 report by the Council of Economic Advisers.
5. In a 2021 Statista survey, respondents cited these as their top supply chain challenges in 2021:
- Supply chain disruptions and shortages (57%)
- Hiring and retaining qualified workers (54%)
- Customer demand for faster response times (51%)
- Out of stock situations (48%)
- Forecasting (46%)
- Customer demand on costs (45%)
- Synchronization of the supply chain (43%)
6. China’s share of world manufacturing exports rose from 3.1% in 1991 to 17.6% in 2015, before dipping to 14.2% in 2018, according to a 2022 report by the Council of Economic Advisers. China is the largest source of U.S. imports, which is why manufacturing disruptions there have had such an impact on U.S. supply chains, a trend that began in the 1990s.
Shipping Delays
7. From January through November 2021, $238 billion worth of cargo experienced “significant” delays outside of the ports of Los Angeles and Long Beach.
8. In March 2021, the Ever Given container ship blocked the Suez Canal for six days. It held up $9.6 billion in commerce each day that it was stuck. 12% of the world’s trade goes through the canal, so the delay caused shipping costs to shoot up.
9. The Suez Canal's westbound traffic is valued at roughly $5.1 billion a day, and eastbound daily traffic at around $4.5 billion, according to shipping expert Lloyd’s List. The blockage caused backlogs worldwide and tightened the market for transport by shipping vessel, an area already strained thanks to a surge in demand for goods.
10. Bloomberg reported this quarter that it’s taking an average 100 days to receive production materials, the longest since records began being kept in 1987, according to the Institute for Supply Management statistics.
11. 56% of retailers experienced a moderate disruption due to the pandemic, according to RetailNext.

Strained Ports
12. The Ever Given is just one example of how mega-container ships—those with a container capacity greater than 10,000 twenty-foot equivalent units (TEUs)—are putting added 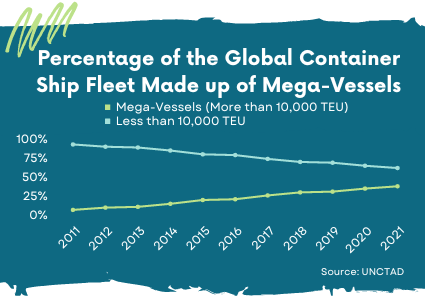 pressure on infrastructure and ports. Between 2011 and 2021, mega-vessel carrying capacity rose from 6% to almost 40%.
13. There have been 97 new ships of between 15,000 and 19,990 TEU, in the last 10 years. Already since 2018, there have been 74 ships of 20,000 TEU or more.
14. $17 billion will be spent on expanding and improving ports in 2022, including $450 million in Department of Transportation grants.
15. Before the pandemic, it took approximately 16 days plus an additional six days until clearance to ship goods from Chinese ports to Los Angeles. Recently, that transit time has run around 60 days, according to the freight forwarding platform Shifl.
Rising Prices
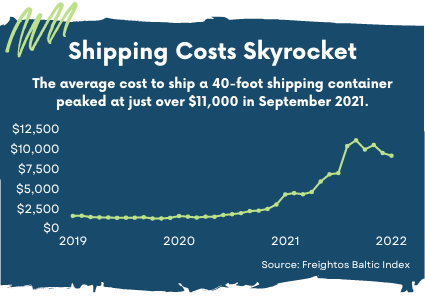
16. The average cost to ship a 40-foot shipping container peaked (for now) at just over $11,000 in September 2021. Before the pandemic, the same container cost just $1,300.
17. In recent months the average cost to ship a 40-foot shipping container has ranged from just over $8,000 to almost $10,000, a slight drop from the peak but still well over pre-pandemic prices.
18. Container shipping costs likely won’t stabilize until at least 2023. However, the last few months have seen slight drops in logistics costs—inventory, transport and warehouse price—likely due to the slowing economy.
19. Air freight options are faster, but typically more expensive. Demand for air cargo capacity rose 18.7% from 2020 to 2021. The increased demand pushed air freight rates up 150% over 2019 levels. But with ocean rates also peaking, an increasing number of companies chose air. Though it isn’t cheaper, inventory is guaranteed to arrive faster.
20. The price index for auto exports rose 1.8% from December 2020 to December 2021, while the price index for auto imports rose 2.8% during that same time period, according to the U.S. Bureau of Labor Statistics. The increase is the result of the rising cost of component parts and a global chip shortage.
21. Prices of motor vehicles (new, used, leased, and rental) increased 21 % during the 12 months of 2021, demonstrating the impact of supply chain disruptions had on consumer goods prices.
22. Auto exports hit an eight-month low by value in February 2021, thanks to a global semiconductor shortage.
Like what you read? Subscribe today to the International Trade Blog to get the latest news and tips for exporters and importers delivered to your inbox.